
Why Website Performance Metrics Don’t Tell the Whole Story
Posted in: Search Engine Optimization · Website
Posted by: Corey Smith on May 4, 2026 at 11:22 am
When your website feels fast, visitors stay longer, explore more pages, and are more likely to convert into leads or customers. Slow experiences drive people away before they ever see your offer. On the search side, Google’s guidance around Core Web Vitals makes it clear that real-world page experience matters, but that does not mean a single lab score tells the whole story.
Website performance metrics are useful diagnostic tools, but they are not absolute truth. PageSpeed Insights and Lighthouse can help you find performance issues, compare improvements, and understand website strategy and technical trade-offs. Real visitors may experience your site differently depending on their device, connection, location, browser, and how your site actually loads for them.
I wanted to explore this more, so I used Smithworks' website as a bit of a test bed. I explored the idea that lab numbers are noisy and often disagree with each other, why chasing a perfect synthetic score almost always means giving something up, and how I made concrete improvements while keeping the features my marketing stack actually needs. The goal was not to prove that scores do not matter; it was to understand what the scores are actually useful for.
As you read through, you'll likely find a number of terms that are new. I've included a glossary at the end of my post to help answer those questions. That glossary is there to make the technical language easier to follow without interrupting the flow of the article.
How PageSpeed Insights and Lighthouse Actually Work
PageSpeed Insights and Lighthouse are lab tools that run in a controlled, emulated environment rather than on a real visitor’s device. The tool loads your page with a simulated mobile device, throttled network, and slowed-down CPU so every test is repeatable and comparable across sites. It is not pulling data from a physical phone sitting in Google’s data center; it applies a standardized stress profile designed to expose bottlenecks consistently.
Even though the environment is controlled, you will still see noticeably different results from run to run. Slight variations in server response times, third-party script loading order, network micro-fluctuations, and exact JavaScript execution timing can still occur, even under the same standardized conditions. This is normal and expected, which is why I recommend running multiple tests and looking for patterns instead of relying on any single run.
The following screenshots illustrate the point. They were all run on the homepage under the same conditions, yet the performance numbers moved around dramatically. That variance is expected, not a sign you are doing it wrong. The lab environment is intentionally harsh so it can surface render-blocking CSS, heavy images, third-party scripts, and layout shifts consistently.
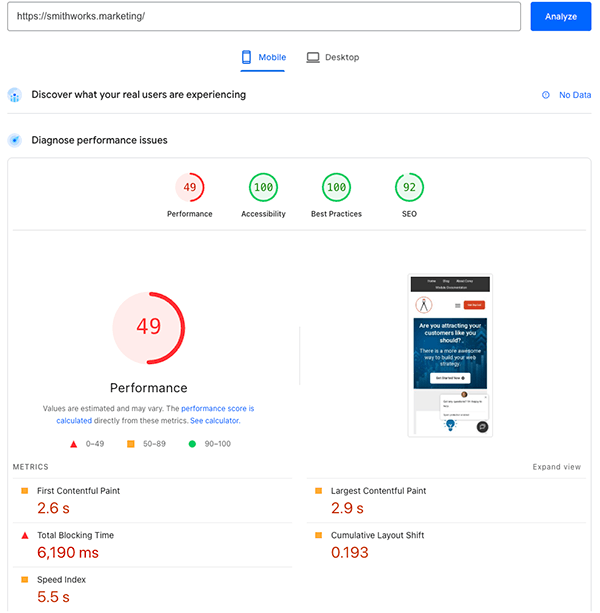
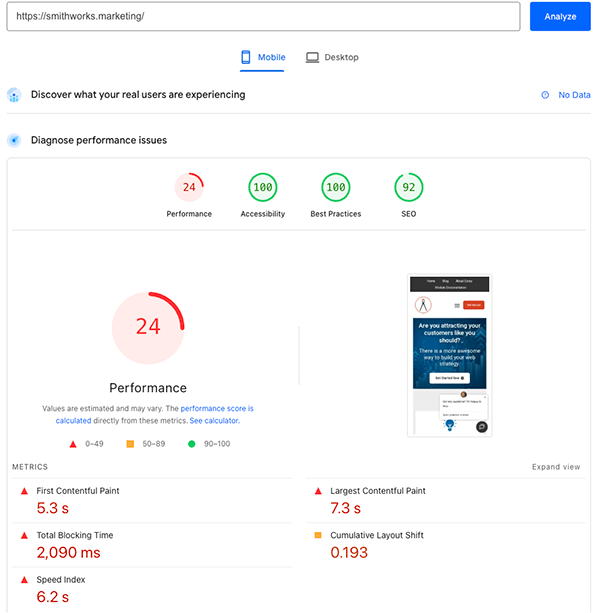
Before ChatBot Removal
The following are two tests run with a ChatBot installed on my site. They were run within a few moments of each other. Even with the same page, same tool, and same general testing window, the results were not identical.
After ChatBot Removal
I wanted to see how the ChatBot affected the performance metric. After I removed the ChatBot from my website, I ran these two tests again within a few minutes of each other. These are the results from that second round of testing.
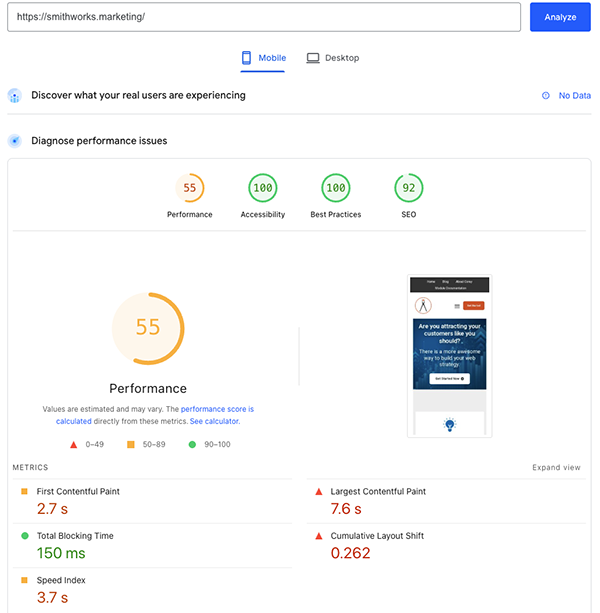
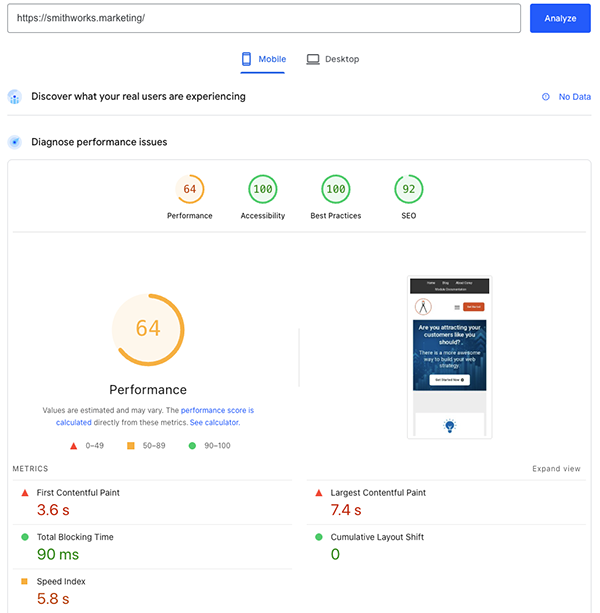
It is a perfect example because the best test before ChatBot removal compared with the worst test after ChatBot removal showed negligible change. But the worst test before ChatBot removal compared with the best test after ChatBot removal showed major improvement. If we take just one run at face value, we cannot paint a realistic picture of what actually improved.
The Pros and Cons of Lab Tests Like PageSpeed Insights and Lighthouse
Lab tools shine when you treat them as diagnostic instruments rather than final report cards. Their biggest strength is repeatability. Because they use the same emulated device, throttled network, and cold-load conditions, you can run before-and-after tests and get a useful sense of whether a change helped.
They also reliably flag render-blocking resources, unused JavaScript, font chains, and layout-shift culprits so you know where to focus next. That does not mean the results are perfect. Because of the natural variation in how the web works, even controlled lab tools are best understood as relatively consistent rather than perfectly consistent.
The downside is that lab results do not perfectly predict how a human on fiber internet or modern hardware will experience the site. A visitor with fast broadband and a newer device may experience the page much faster than the lab result suggests. Someone on weaker hardware or a high-latency connection may experience worse performance than the model predicts.
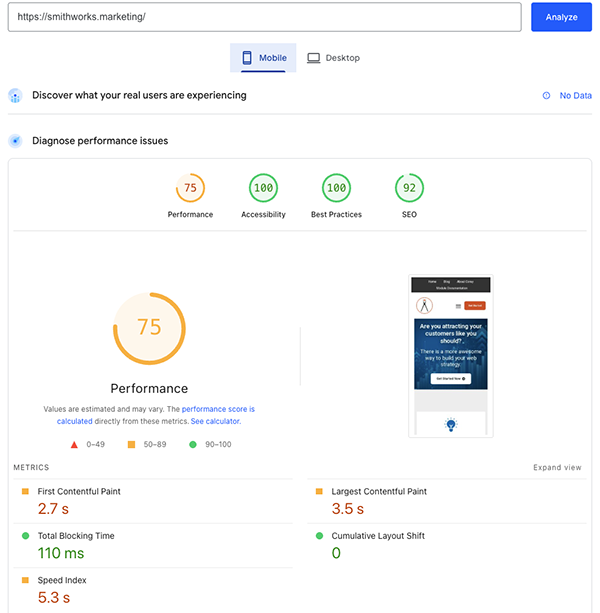
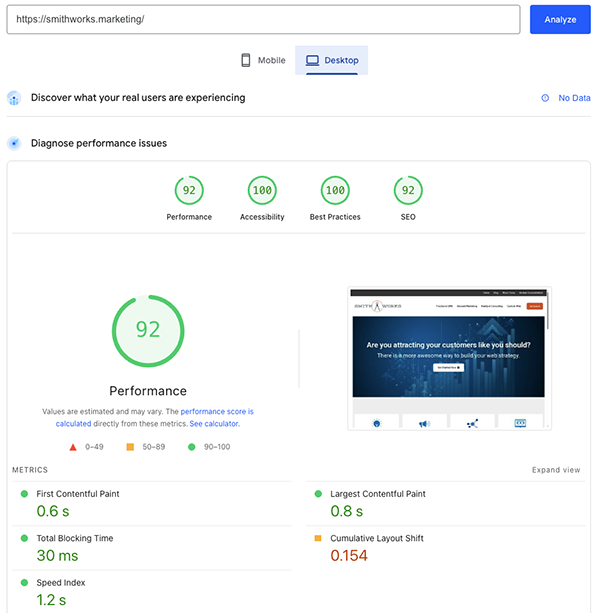
One of the clearest ways to see the difference between lab conditions and real-world use is by comparing the same URL under mobile and desktop profiles in PageSpeed Insights. Mobile applies much heavier throttling, which is why the Performance score can drop even when the page markup is identical. After I completed the optimization I wanted to complete, this was the resulting comparison of Mobile vs Desktop. Same site, same test, different results based on the platform profile being tested.
| Mobile | Desktop | |
|---|---|---|
| Performance (0–100) | 68 (needs improvement) | 92 (good) |
| LCP | 7.1 s | 0.8 s |
| FCP | 2.7 s | 0.6 s |
| Speed Index | 5.3 s | 1.2 s |
| TBT | 110 ms | 30 ms |
| CLS | 0 | 0.154 (needs improvement on that run) |
| Accessibility | 100 | 100 |
| Best Practices | 100 | 100 |
| SEO | 92 | 92 |
Performance Is Always a Business Trade-Off
Every capability you add to a marketing site competes for bytes, main-thread time, and layout stability. On my website, the cost stack showed up repeatedly in Lighthouse and PageSpeed Insights runs. None of these costs were surprising, but seeing them side by side made the trade-offs easier to understand.
| What you might want | What the lab often charges you |
|---|---|
| Large hero imagery (full-bleed, high resolution, multiple breakpoints) | LCP weight and decode cost; Speed Index paints later unless you aggressively size and prioritize the real LCP candidate. |
| Video (background, embed, HubSpot video) | Extra bytes, poster images, and sometimes main-thread work depending on how it is loaded. |
| JavaScript-heavy features | Total Blocking Time, long tasks—HubSpot visitor / bundle code, GTM, reCAPTCHA, web interactives, etc. |
| Live chat / Conversations | Main thread, network, and sometimes CLS dominated by the chat widget. |
| Analytics and tag managers | Unused JS warnings and attribution work. |
| HubSpot “collect non-HubSpot forms” | Additional scripts and traffic that add visible lab cost. |
| Brand typography + icon fonts | Render-blocking CSS chains and font-display nags. |
| Preconnect hints | Warnings when more than four are used or when they are unused. |
These are the real trade-offs of the little decisions we make while building and optimizing a site. None of these items are inherently bad. They are deliberate business choices. If you want live chat during business hours, full GA4 and GTM tracking, reCAPTCHA protection, rich hero imagery, and HubSpot form intelligence, you should expect lab scores to reflect that weight.
The honest conversation is not whether those tools have a performance cost. They do. The honest conversation is which concessions you are willing to make and which non-negotiables need to stay in place. Performance metrics may be reduced when you keep those capabilities, and that can still be the right trade-off when the features support leads, analytics, security, customer experience, and your broader HubSpot consulting strategy.
Just a little side note: the same problems can exist on any website. This post focuses on HubSpot because this website is built in HubSpot. If the site is built in WordPress, Drupal, or plain HTML, there is still a certain amount of technical overhead you have to decide is important enough to keep.
What the Final Decisions on This Site Actually Showed
I took the big hero image at the top of the page seriously. I added special code so the website shows a smaller, faster-loading image on phones and tablets and a larger one on big computer screens. I also made several behind-the-scenes improvements, removed some animations, cleaned up JavaScript, and deleted the code for the HubSpot chat widget because I decided not to use it anymore.
That was just part of what I did. Even after those changes, one set of tests still showed the mobile loading time jumping around, sometimes around 13 seconds and other times around 6 seconds. That did not mean the improvements failed. The same page had shown big swings like this before, and that kind of variation is part of what lab testing reveals.
The site still feels fast to real visitors on normal home Wi-Fi or office internet. That matters because most people are not using the super-slow, stressed-out conditions that the testing tool uses. Lab tools test a harsh scenario. Real users and real-world data show whether your site actually feels good to the people who matter.
The Final Results
Does a Lower PageSpeed Insights Score Hurt SEO?
You might have noticed that my SEO result was consistently at 92 while my Accessibility and Best Practices were consistently at 100. The technical work and tests in this post mostly affected the Performance number. That raises a fair question: if performance is low, does that have a negative impact on SEO?
The right answer is, maybe, but probably not as much as you might guess. Google says there is no single page experience signal, and its guidance explains that site owners should not focus on only one or two aspects of page experience. It also says Core Web Vitals are used by Google’s ranking systems, but getting good results in tools does not guarantee top rankings. In other words, there is no clean mapping like: “Lighthouse Performance = 58 ⇒ rankings −X.”
Google wants to provide the best experience and content to its users. So, yes, we want a site to be faster. But we still have to be willing to accept some performance trade-offs when those trade-offs support the actual user experience, lead capture, analytics, security, or business purpose of the site.
And, back to my 92 in SEO versus a perfect 100: this post has been about trade-offs in performance. The reality is, there may be other trade-offs you decide to make depending on the experience you want. I have strategically chosen a few trade-offs in SEO. Nothing is ever absolute, although I do think there is rarely a good excuse for Accessibility and Best Practices not to be at or near 100.
Choosing the Right Trade-Offs for Your Business
Lab results will sometimes disagree with each other, and they will sometimes disagree with how the site feels. That is okay. What matters is optimizing inside the rails of your actual business requirements while using the tools exactly as intended: to surface the next best improvement and expose the real trade-offs.
We are not optimizing for a screenshot of a score. We are optimizing for your visitors, your compliance and analytics requirements, your lead generation needs, and the experience signals search engines evaluate in the real world. A fast site matters, but a fast site stripped of the tools that make your marketing work may not actually serve the business.
The screenshot examples above, along with the concrete before-and-after data from my own testing on this website, show that performance work is both technical and strategic. If you are ready to move from diagnosis to action, I have also written about 10 Ways to Improve Your Website Performance. When you approach performance with that mindset, the numbers become useful instead of stressful.
Frequently Asked Questions About Website Performance Metrics
Website performance metrics create a lot of reasonable questions because the numbers can look more precise than they really are. A score of 68 feels specific, but it does not tell the whole story by itself. The better approach is to understand what the tool is measuring, what it is not measuring, and how that information should guide your next decision.
The questions below are the ones I would expect a business owner, marketer, or website manager to ask after seeing a performance report. They are not meant to replace the rest of the article. They are here to clarify the practical decisions behind the data.
Does PageSpeed Insights directly affect SEO?
PageSpeed Insights does not directly determine your rankings by itself. It is a diagnostic tool that helps you understand performance issues that may affect user experience. Google cares about real-world page experience, but there is not a single PageSpeed score that automatically moves rankings up or down.
Related Posts: 10 Signs Your Website Might Be Underperforming · 10 Ways to Improve Your Website Performance · Rebuilding Your Website with SEO in Mind
Why does my Lighthouse score change between tests?
Lighthouse scores can change because small variations still happen during each test. Server response time, third-party scripts, JavaScript timing, and network behavior can all affect the result. That is why one test is not enough; run several tests and look for patterns instead of reacting to a single number.
Related Posts: WordPress Thinking Creates Bad Websites · Technology Doesn't Matter · Sprocket Rocket: The Gold Standard in HubSpot Theming
Is lab data or field data more important?
Field data is usually more useful for understanding how real users experience your site. Lab data is better for diagnosing problems in a controlled environment. You need both because lab data helps you find what to fix, while field data helps you understand what visitors actually experience.
Related Posts: 10 Signs Your Website Might Be Underperforming · Rebuilding Your Website with SEO in Mind · Making Your Website Accessible: Why It Matters and How to Start
Should I remove HubSpot scripts to improve performance?
Only remove HubSpot scripts if the feature they support is not important to your business. Some scripts add performance cost, but they may also support forms, analytics, automation, attribution, or lead capture. The better question is not whether every script has a cost; the better question is whether the business value of that script is worth the performance trade-off.
Related Posts: Sprocket Rocket: The Gold Standard in HubSpot Theming · WordPress Thinking Creates Bad Websites · Technology Doesn't Matter
Glossary of Key Performance Terms
PageSpeed Insights (PSI)
Google’s free tool that runs Lighthouse audits to measure website performance. It provides both lab data and real-user field data when available. It is one of the most widely used performance testing tools, but it should be treated as a diagnostic tool rather than a complete measure of user experience.
Lighthouse
Google’s open-source auditing tool that evaluates performance, accessibility, best practices, and SEO. It powers PageSpeed Insights and helps identify issues with Core Web Vitals, render-blocking resources, layout shifts, and other quality signals. Its results come from a controlled lab environment.
Lab Tests (Lab Data)
Controlled, synthetic performance tests that simulate a throttled mobile device, slow network, and reduced CPU. They are repeatable and excellent for diagnosing issues. They do not always match real user experience.
Field Data / Real-User Data (CrUX)
Actual performance metrics collected from real Chrome users visiting your site. This data reflects genuine visitor experiences across devices, connections, and locations. It is especially useful because it shows how real people experience your site, not only how the site performs in a lab test.
Largest Contentful Paint (LCP)
A Core Web Vital metric that measures loading performance. It tracks how quickly the largest image or text block becomes visible. Aim for under 2.5 seconds for good performance.
First Contentful Paint (FCP)
The time it takes for the first piece of content, such as text or an image, to appear on the screen. Faster FCP contributes to a better perceived loading speed. It helps you understand when the page first starts to feel visible to the visitor.
Speed Index
A performance metric that shows how quickly a page’s visible content is populated during load. Lower numbers mean the page feels faster to users. It is especially useful when comparing before-and-after optimization work.
Total Blocking Time (TBT)
The total time the main thread is blocked by long tasks, preventing the page from responding to user input. Lower TBT creates a smoother, more responsive experience. JavaScript-heavy features often increase TBT.
Cumulative Layout Shift (CLS)
A Core Web Vital that measures visual stability. It tracks unexpected layout shifts while the page loads. A good score is under 0.1 for a stable, frustration-free experience.
Core Web Vitals
Google’s key user experience metrics for loading performance, interactivity, and visual stability. The current set includes LCP, CLS, and Interaction to Next Paint. Strong Core Web Vitals support a better user experience and are part of the broader way Google evaluates page experience.
Render-blocking Resources
CSS or JavaScript files that stop the browser from rendering the page until they finish loading. Optimizing these can improve perceived speed and performance scores. PageSpeed Insights and Lighthouse often flag these resources because they can delay what the visitor sees first.
Preconnect Hints
HTML instructions that tell the browser to establish early connections to important third-party domains. Used properly, they can speed up loading of fonts, scripts, and analytics. When overused or unused, they can create warnings instead of benefits.
HubSpot Collected Forms
A HubSpot feature that auto-captures submissions from non-HubSpot forms. While useful for lead generation, it adds extra JavaScript that can increase Total Blocking Time and hurt lab scores. Whether that trade-off is worth it depends on how important the feature is to your marketing process.
Answer Engine Optimization (AEO)
Optimizing your website and content so it is easier for AI-powered answer engines, featured snippets, and search systems to understand and summarize. Strong AEO content is clear, specific, structured, and useful. Performance can support that experience, but performance alone does not make a page answer-worthy.

About Corey Smith
Ready to simplify and succeed? Let’s make it happen—because your business deserves practical, no-nonsense wins. Find me on LinkedIn.


